Edit chart
Loading graph
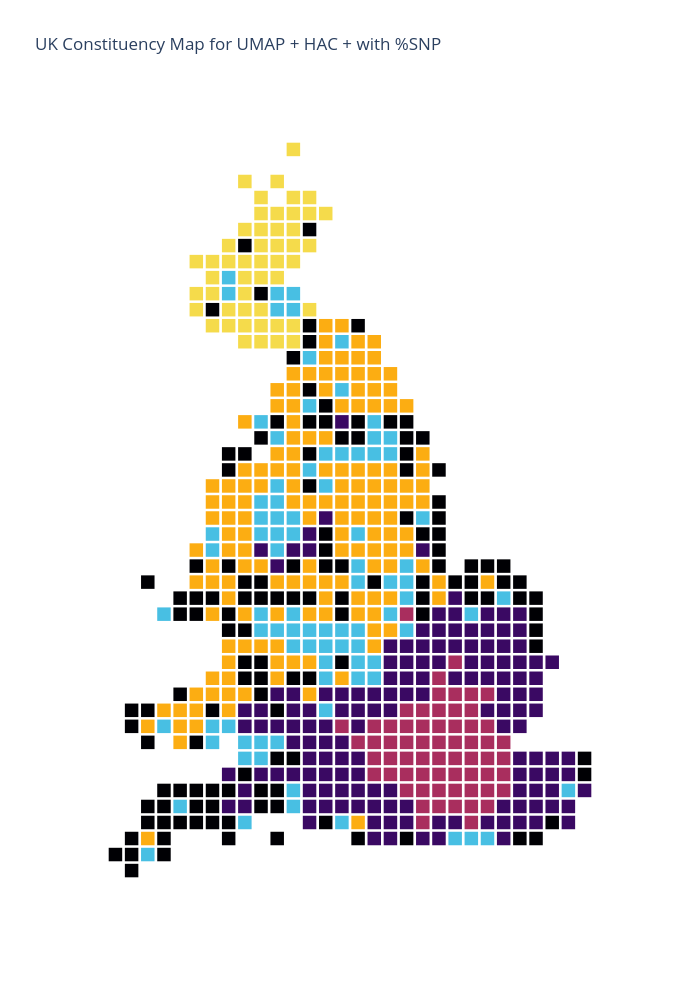
Kaasiak's interactive graph and data of "UK Constituency Map for UMAP + HAC + with %SNP" is a scatter chart, showing E, D, B, F, A, C; with X in the x-axis and Y in the y-axis.. The x-axis shows values from 0 to 0. The y-axis shows values from 0 to 0.