Edit chart
Loading graph
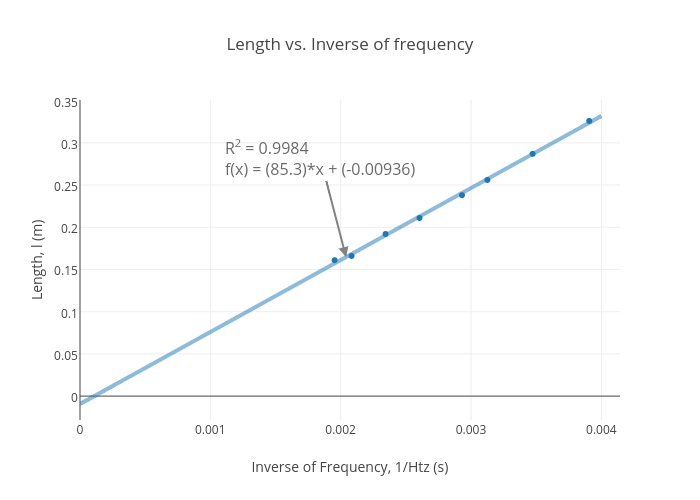
Jakobhofstad's interactive graph and data of "Length vs. Inverse of frequency" is a scatter chart, showing Col2 vs Col2 - fit; with Inverse of Frequency, 1/Htz (s) in the x-axis and Length, l (m) in the y-axis.. The x-axis shows values from 0 to 0.004134863018811586. The y-axis shows values from -0.028310452241166448 to 0.3507398695324636. This visualization has the following annotation: R2 = 0.9984f(x) = (85.3)*x + (-0.00936)