Edit chart
Loading graph
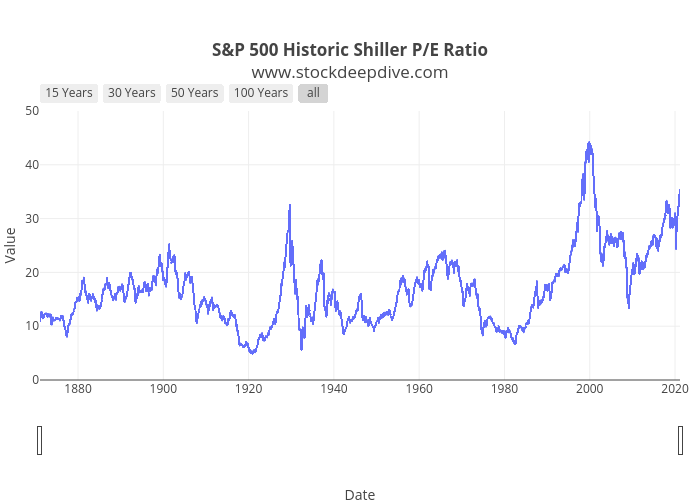
Jakespeers's interactive graph and data of "S&P 500 Historic Shiller P/E Ratiowww.stockdeepdive.com" is a scattergl; with Date in the x-axis and Value in the y-axis.. The x-axis shows values from 1871-02-01 to 2021-03-01. The y-axis shows values from 0 to 50.