Edit chart
Loading graph
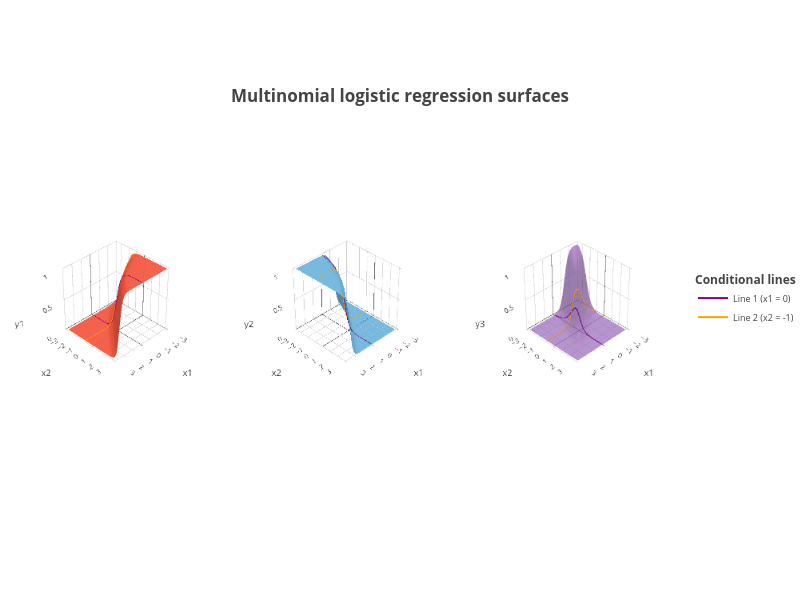
Jakejing's interactive graph and data of "Multinomial logistic regression surfaces" is a surface, showing Line 1 (x1 = 0), Line 2 (x2 = -1), Line 1 (x1 = 0), Line 2 (x2 = -1), Line 1 (x1 = 0), Line 2 (x2 = -1). The x-axis shows values from 0 to 0. The y-axis shows values from 0 to 0.