Edit chart
Loading graph
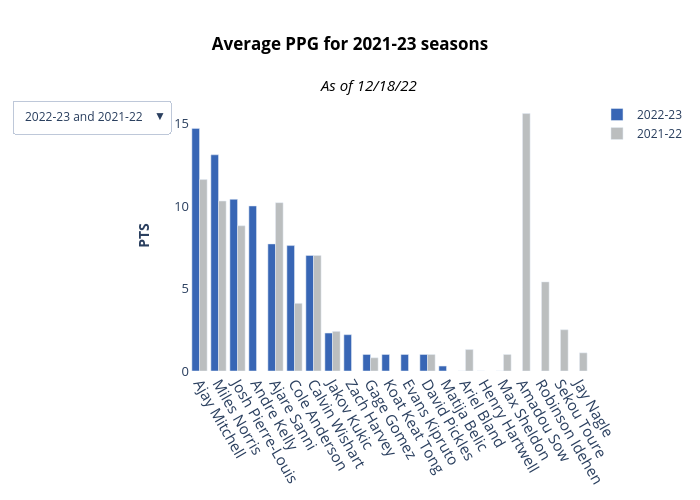
Jakejensema's interactive graph and data of "Average PPG for 2021-23 seasons" is a bar chart, showing 2022-23 vs 2021-22; with PTS in the y-axis. The x-axis shows values from 0 to 0. The y-axis shows values from 0 to 0. This visualization has the following annotation: As of 12/18/22