Edit chart
Loading graph
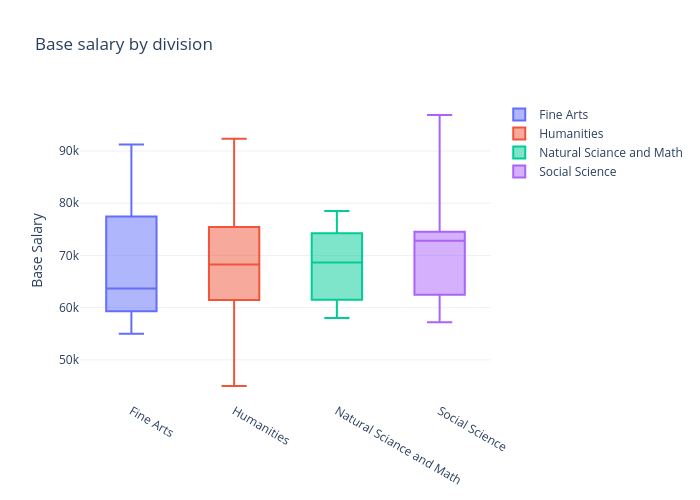
Jacksontransy's interactive graph and data of "Base salary by division" is a box plot, showing Fine Arts, Humanities, Natural Sciance and Math, Social Science; with Base Salary in the y-axis. The x-axis shows values from -0.5 to 3.5. The y-axis shows values from 42117.333333333336 to 99770.66666666667.