Edit chart
Loading graph
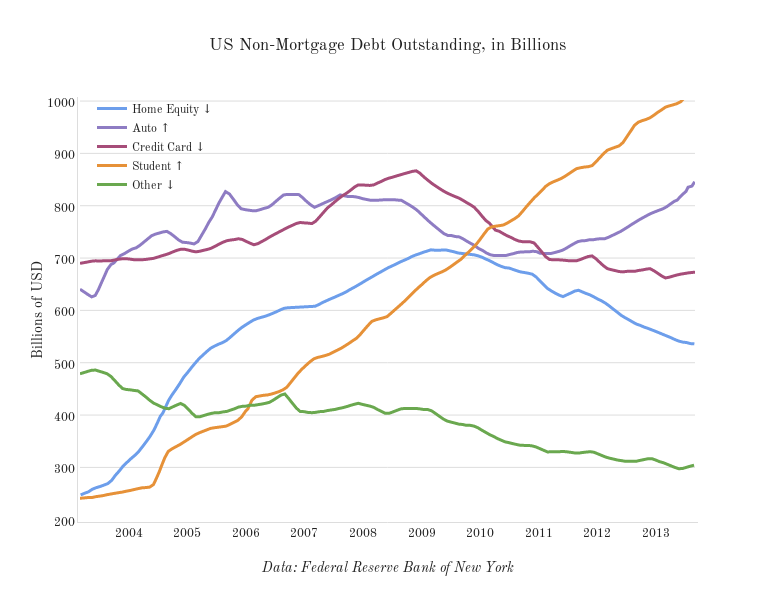
Jstevens's interactive graph and data of "US Non-Mortgage Debt Outstanding, in Billions" is a scatter chart, showing Home Equity ↓, Auto ↑, Credit Card ↓, Student ↑, Other ↓; with Data: Federal Reserve Bank of New York in the x-axis and Billions of USD in the y-axis.. The x-axis shows values from 1046754000000 to 1378008000000. The y-axis shows values from 199.5 to 1002.