Edit chart
Loading graph
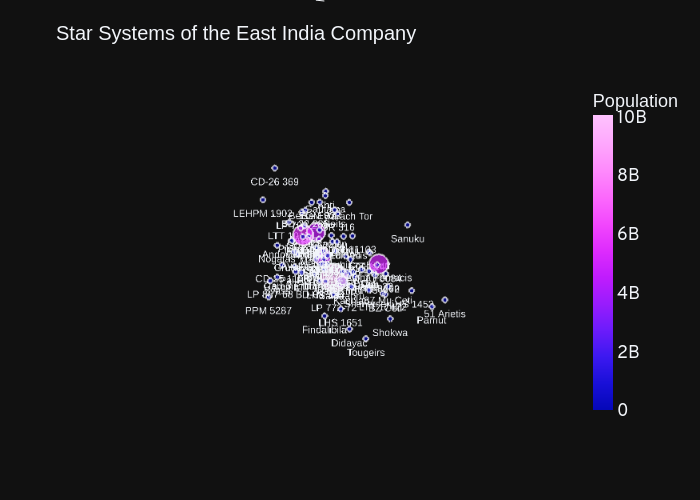
Icarus.smith's interactive graph and data of "Star Systems of the East India Company" is a scatter3d, showing EIC. The x-axis shows values from 12.234375 to 14.234375. The y-axis shows values from -72 to -70. This visualization has the following annotation: