Edit chart
Loading graph
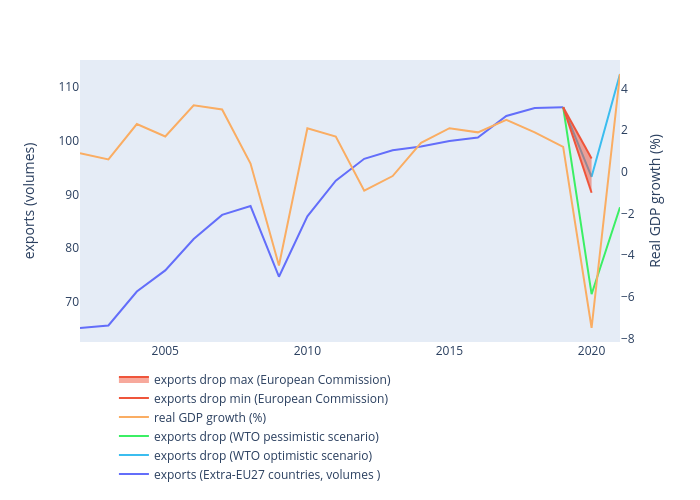
Iacopom's interactive graph and data of "exports (volumes) vs " is a line chart, showing exports (Extra-EU27 countries, volumes ), exports drop (WTO optimistic scenario), exports drop (WTO pessimistic scenario), real GDP growth (%), exports drop min (European Commission), exports drop max (European Commission); with in the x-axis and exports (volumes) in the y-axis.. The x-axis shows values from 2002 to 2021. The y-axis shows values from 62.50277777777777 to 115.04722222222222.