Edit chart
Loading graph
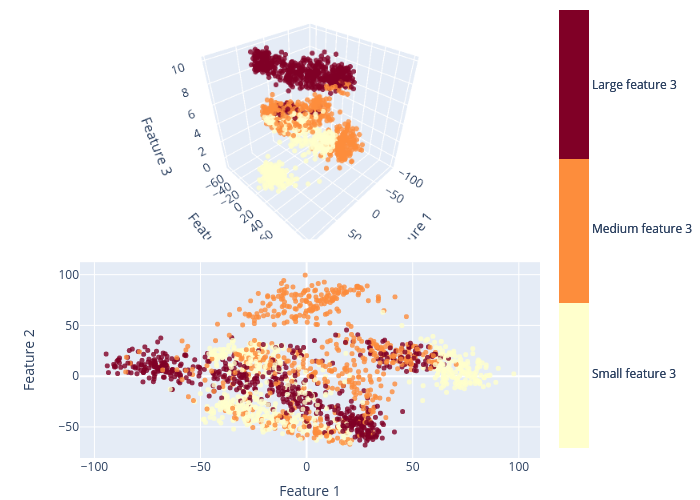
Hugo_tdab's interactive graph and data of "Feature 2 vs Feature 1" is a scatter3d; with Feature 1 in the x-axis and Feature 2 in the y-axis.. The x-axis shows values from -106.296708083578 to 109.48842144660618. The y-axis shows values from -78.80880546469892 to 110.45229528224132.