Edit chart
Loading graph
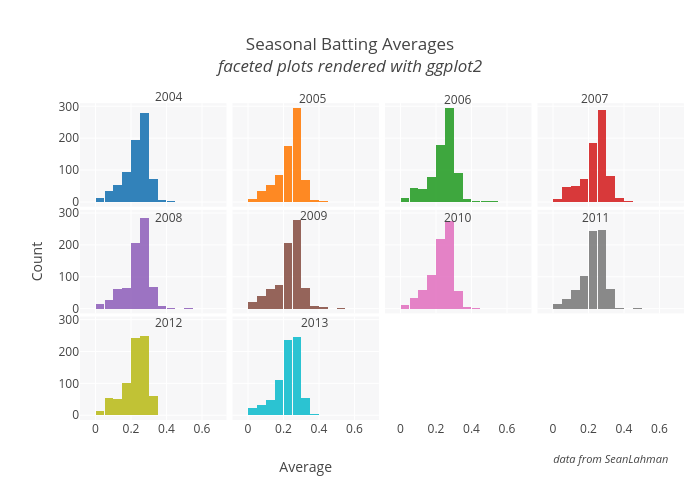
Hasselfallas77's interactive graph and data of "Seasonal Batting Averagesfaceted plots rendered with ggplot2" is a stacked bar chart, showing 2004, 2005, 2006, 2007, 2008, 2009, 2010, 2011, 2012, 2013. The x-axis shows values from -0.0875 to 0.7375. The y-axis shows values from -14.75 to 309.75. This visualization has the following annotations: 2004; 2005; 2006; 2007; 2008; 2009; 2010; 2011; 2012; 2013