Edit chart
Loading graph
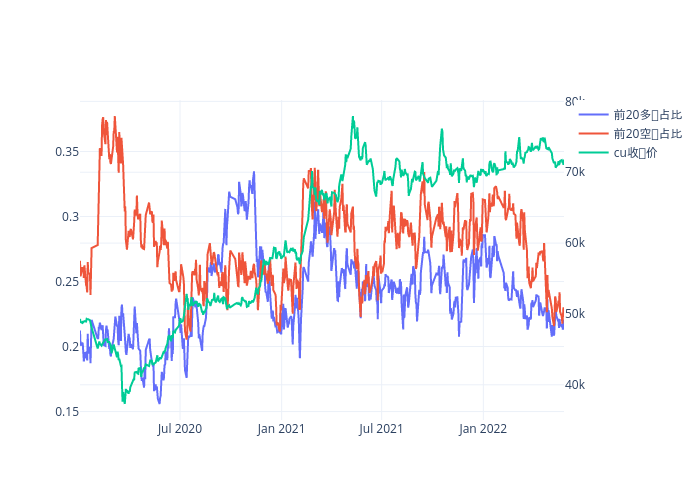
Haruki77's interactive graph and data of "前20多头占比, 前20空头占比, cu收盘价" is a line chart, showing 前20多头占比, 前20空头占比, cu收盘价; with time in the x-axis. The x-axis shows values from 2020-01-02 to 2022-05-27. The y-axis shows values from 0.1435140423888889 to 0.38963559461111114.