Edit chart
Loading graph
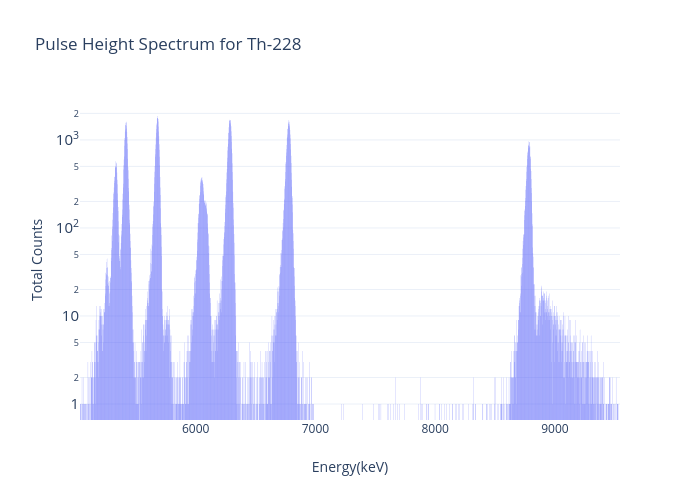
Hannah23360's interactive graph and data of "Pulse Height Spectrum for Th-228" is a bar chart; with Energy(keV) in the x-axis and Total Counts in the y-axis.. The x-axis shows values from 5034.133000000001 to 9543.341. The y-axis shows values from -0.18176897814091666 to 3.4536105846774157.