Edit chart
Loading graph
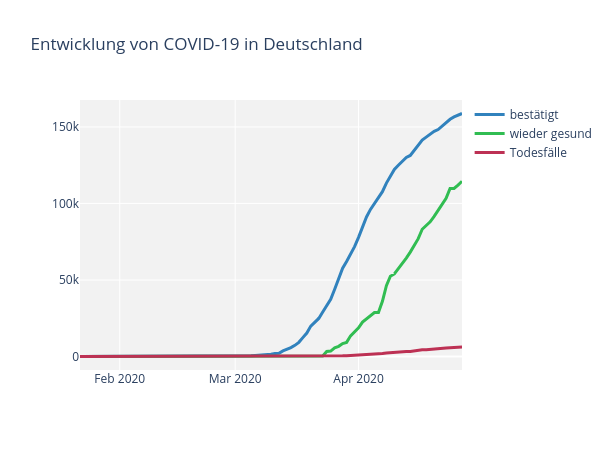
Haidole.hdl's interactive graph and data of "Entwicklung von COVID-19 in Deutschland" is a line chart, showing bestätigt, wieder gesund, Todesfälle. The x-axis shows values from 0 to 0. The y-axis shows values from 0 to 0.