Edit chart
Loading graph
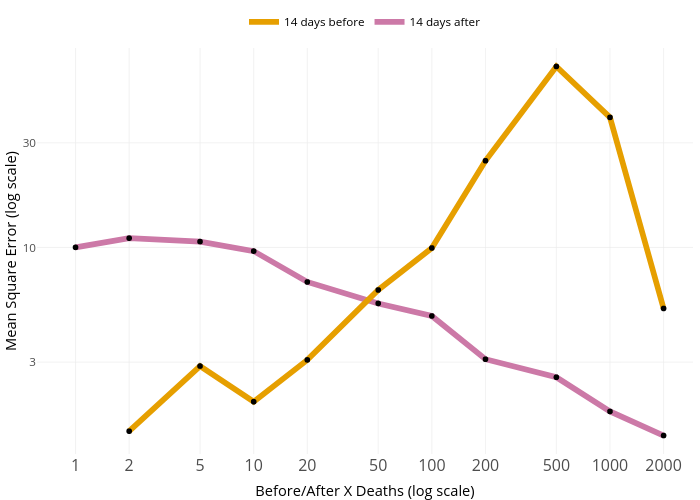
Griffink's interactive graph and data of "Mean Square Error (log scale) vs Before/After X Deaths (log scale)" is a line chart, showing 14 days after vs 14 days before; with Before/After X Deaths (log scale) in the x-axis and Mean Square Error (log scale) in the y-axis.. The x-axis shows values from -0.21637493434475896 to 3.46608149544718. The y-axis shows values from 0.05837498054207524 to 1.90926704658005.