Edit chart
Loading graph
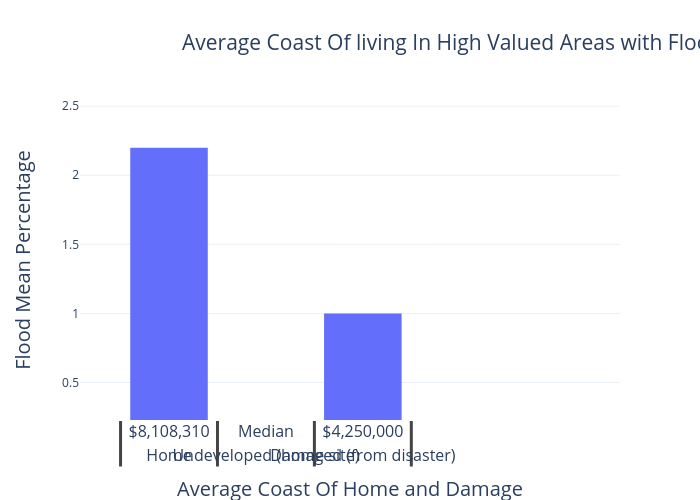
Gilzman's interactive graph and data of "Average Coast Of living In High Valued Areas with Flood Average Possibility's. " is a bar chart; with Average Coast Of Home and Damage in the x-axis and Flood Mean Percentage in the y-axis.. The x-axis shows values from 0.08153491015391898 to 5.653311841194576. The y-axis shows values from 0.2289183582469383 to 2.544707831931149.