Edit chart
Loading graph
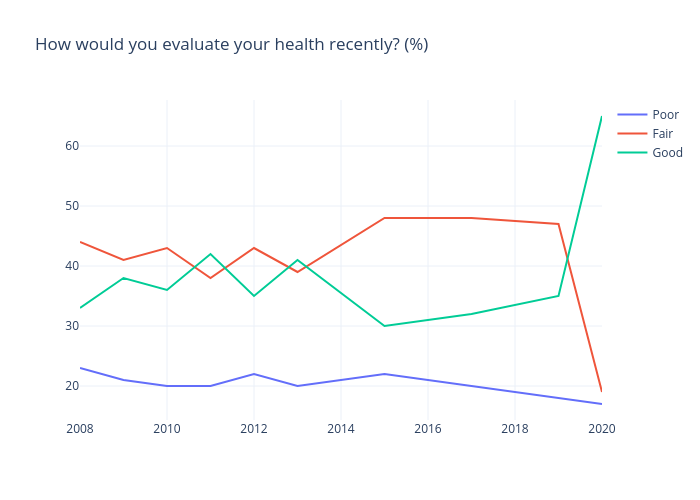
Gilbreathdustin's interactive graph and data of "How would you evaluate your health recently? (%)" is a line chart, showing Poor, Fair, Good. The x-axis shows values from 2008 to 2020. The y-axis shows values from 14.333333333333332 to 67.66666666666667.