Edit chart
Loading graph
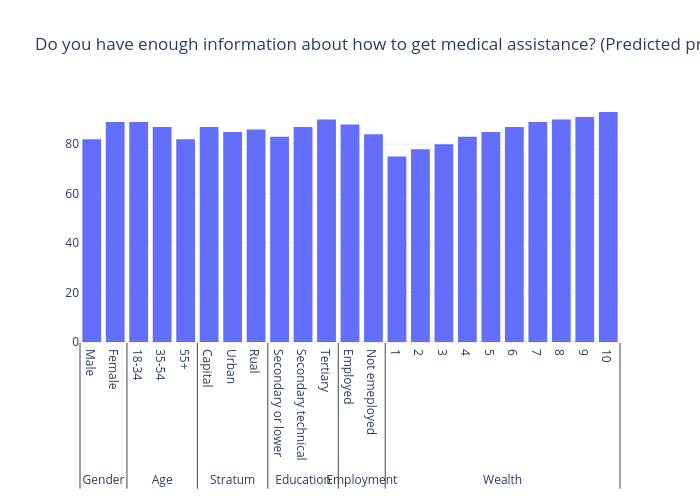
Gilbreathdustin's interactive graph and data of " Do you have enough information about how to get medical assistance? (Predicted probability yes)" is a bar chart. The x-axis shows values from -0.5 to 22.5. The y-axis shows values from 0 to 97.89473684210526.