Edit chart
Loading graph
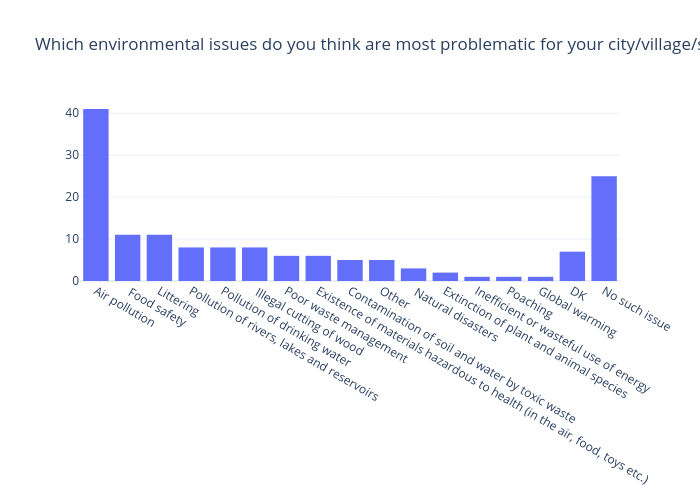
Gilbreathdustin's interactive graph and data of "Which environmental issues do you think are most problematic for your city/village/settlement? (%)" is a bar chart. The x-axis shows values from -0.5 to 16.5. The y-axis shows values from 0 to 43.1578947368421.