Edit chart
Loading graph
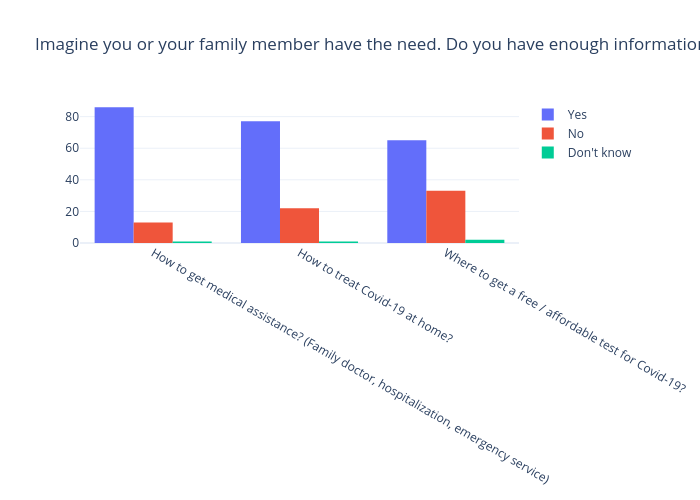
Gilbreathdustin's interactive graph and data of "Imagine you or your family member have the need. Do you have enough information about… (%)" is a bar chart, showing Yes, No, Don't know. The x-axis shows values from -0.5 to 2.5. The y-axis shows values from 0 to 90.52631578947368.