Edit chart
Loading graph
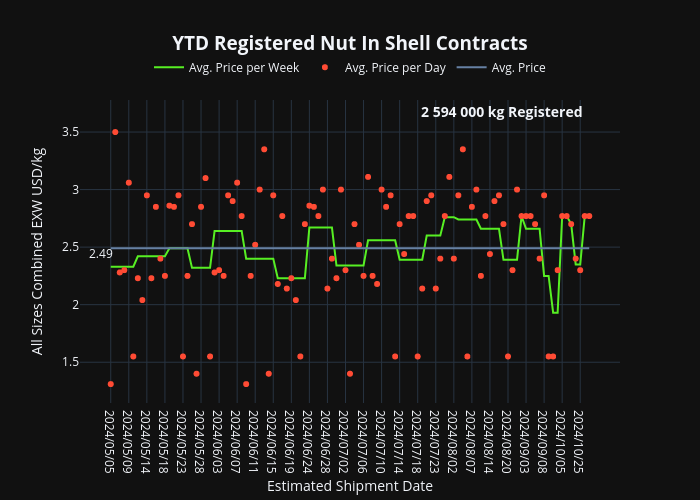
Gerhardmacsm.org's interactive graph and data of "YTD Registered Nut In Shell Contracts" is a line chart, showing Avg. Price per Week, Avg. Price per Day, Avg. Price; with Estimated Shipment Date in the x-axis and All Sizes Combined EXW USD/kg in the y-axis.. The x-axis shows values from -6.43014705882353 to 112.43014705882354. The y-axis shows values from 1.1416815468613866 to 3.778346333021169. This visualization has the following annotations: 2 594 000 kg Registered; 2.49