Edit chart
Loading graph
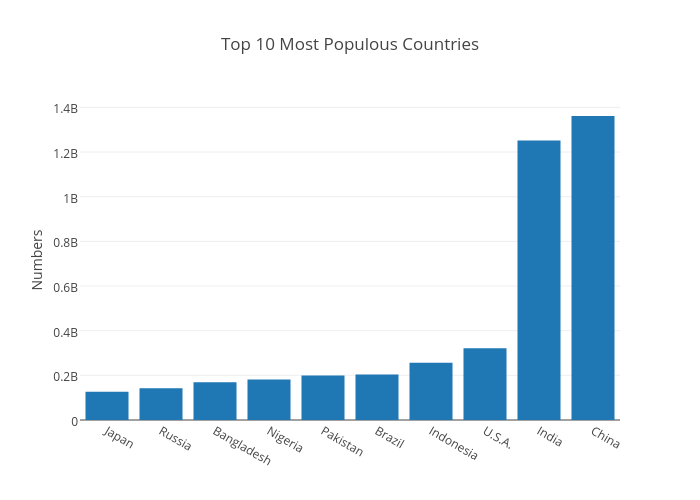
Gkanellos's interactive graph and data of "Top 10 Most Populous Countries " is a bar chart, showing Col1; with Numbers in the y-axis. The x-axis shows values from -0.5 to 9.5. The y-axis shows values from 0 to 1433171089.4736843.