Edit chart
Loading graph
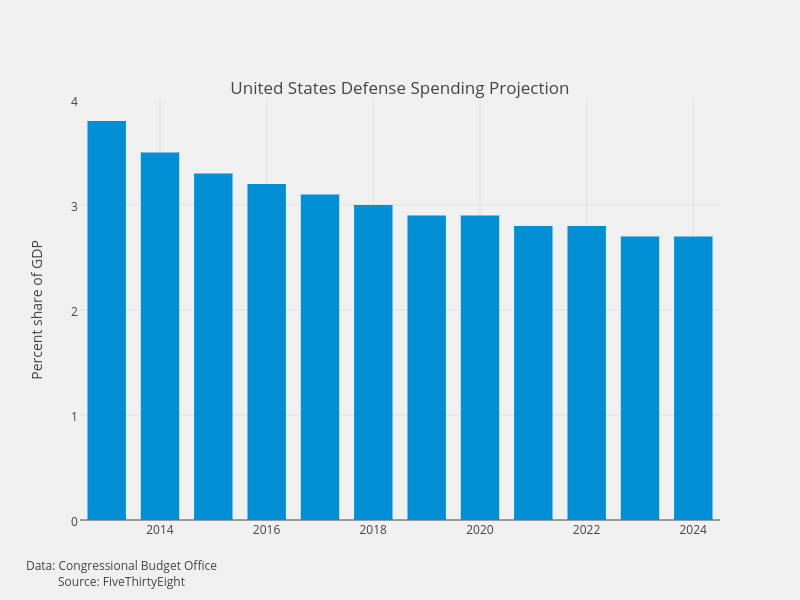
Fivethirtyeight's interactive graph and data of "United States Defense Spending Projection" is a bar chart, showing Share of GDP; with Percent share of GDP in the y-axis. The x-axis shows values from 2012.5 to 2024.5. The y-axis shows values from 0 to 4. This visualization has the following annotation: Data: Congressional Budget OfficeSource: FiveThirtyEight