Edit chart
Loading graph
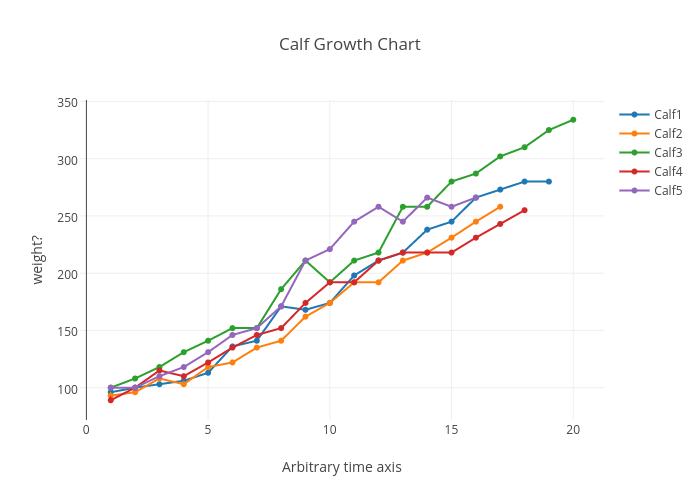
Farmermatt's interactive graph and data of "Calf Growth Chart" is a line chart, showing Calf1, Calf2, Calf3, Calf4, Calf5; with Arbitrary time axis in the x-axis and weight? in the y-axis.. The x-axis shows values from -0.1096727334871399 to 21.10967273348714. The y-axis shows values from 73.39604685212298 to 349.603953147877.