Edit chart
Loading graph
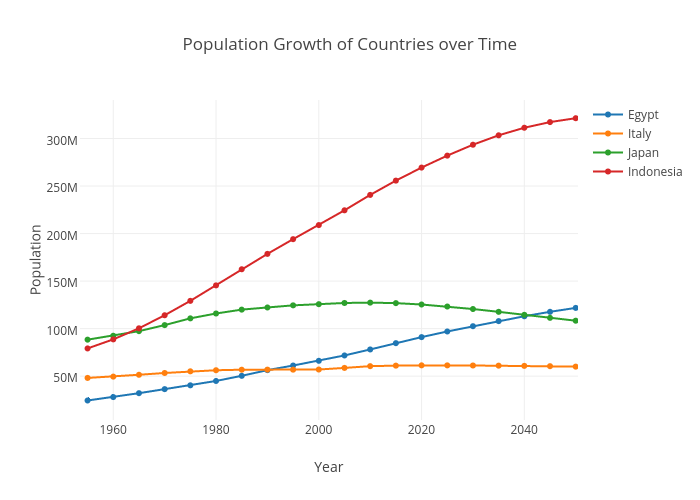
Evankuhn's interactive graph and data of "Population Growth of Countries over Time" is a line chart, showing Egypt, Italy , Japan, Indonesia; with Year in the x-axis and Population in the y-axis.. The x-axis shows values from 1953.5258159225746 to 2050.444943225115. The y-axis shows values from 3866074.2111247033 to 340521280.602531.