Edit chart
Loading graph
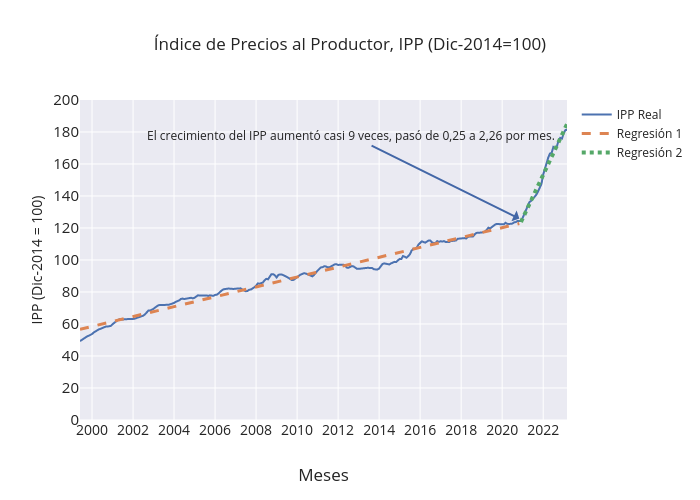
Ericdavila's interactive graph and data of "Índice de Precios al Productor, IPP (Dic-2014=100)" is a line chart, showing IPP Real, Regresión 1, Regresión 2; with Meses in the x-axis and IPP (Dic-2014 = 100) in the y-axis.. The x-axis shows values from 1999-06-01 to 2023-03-01. The y-axis shows values from 0 to 200. This visualization has the following annotation: El crecimiento del IPP aumentó casi 9 veces, pasó de 0,25 a 2,26 por mes.