Edit chart
Loading graph
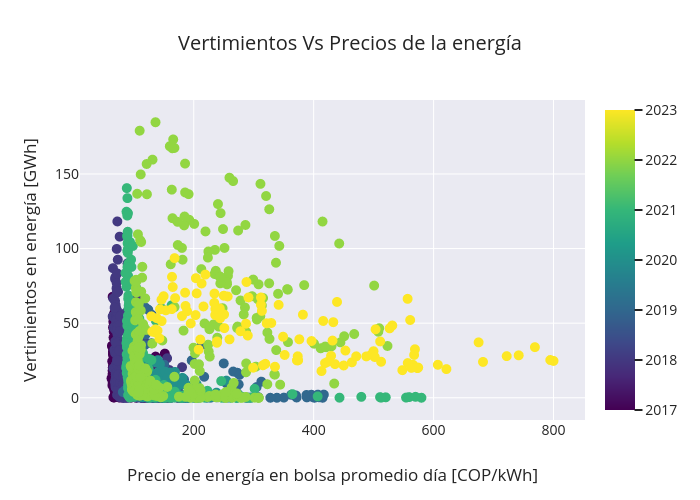
Ericdavila's interactive graph and data of "Vertimientos Vs Precios de la energía" is a scatter chart, showing Aportes de lluvia; with Precio de energía en bolsa promedio día [COP/kWh] in the x-axis and Precio de la energía [COP/kWh] in the y-axis.. The x-axis shows values from 17.234804640896897 to 845.5355714291031. The y-axis shows values from 21.840159851666662 to 840.9302162183334.