Edit chart
Loading graph
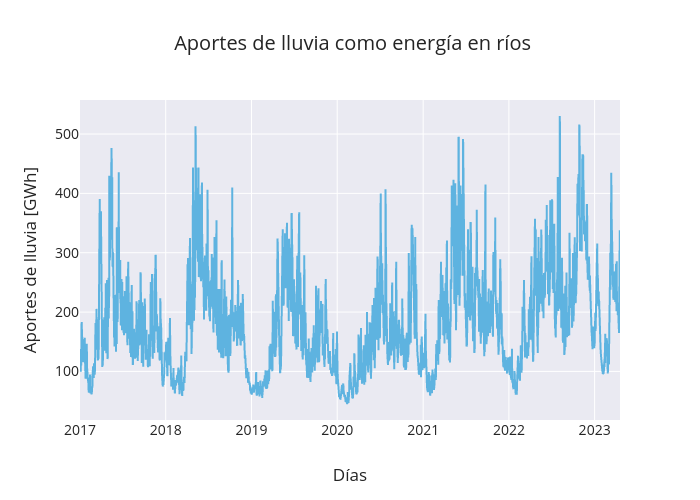
Ericdavila's interactive graph and data of " Aportes de lluvia como energía en ríos" is a line chart, showing Aportes de lluvia; with Días in the x-axis and Precio de la energía [COP/kWh] in the y-axis.. The x-axis shows values from 2017-01-01 to 2023-04-19. The y-axis shows values from 21.840159851666662 to 840.9302162183334.