Edit chart
Loading graph
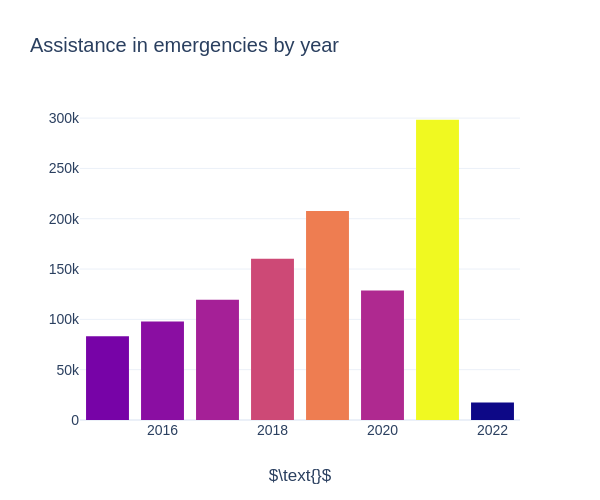
Ena123's interactive graph and data of "Assistance in emergencies by year" is a bar chart; with $\text{}$ in the x-axis. The x-axis shows values from 2014.5 to 2022.5. The y-axis shows values from 0 to 314011.5789473684.