Edit chart
Loading graph
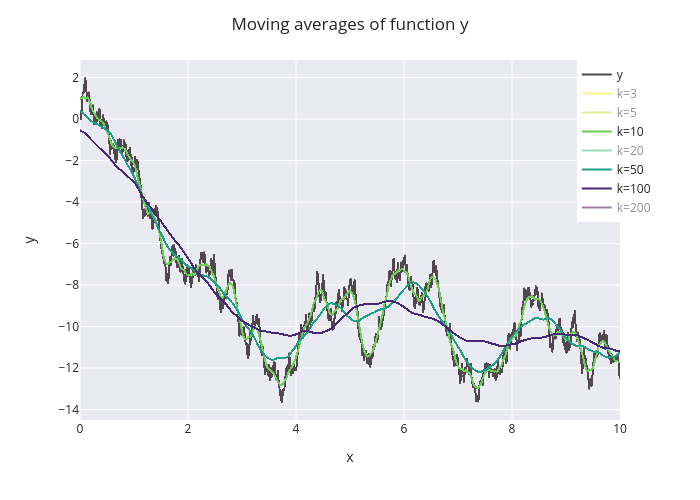
Eloisanchez's interactive graph and data of "Moving averages of function y" is a scattergl, showing y, k=3, k=5, k=10, k=20, k=50, k=100, k=200; with x in the x-axis and y in the y-axis.. The x-axis shows values from 0 to 0. The y-axis shows values from 0 to 0.