Edit chart
Loading graph
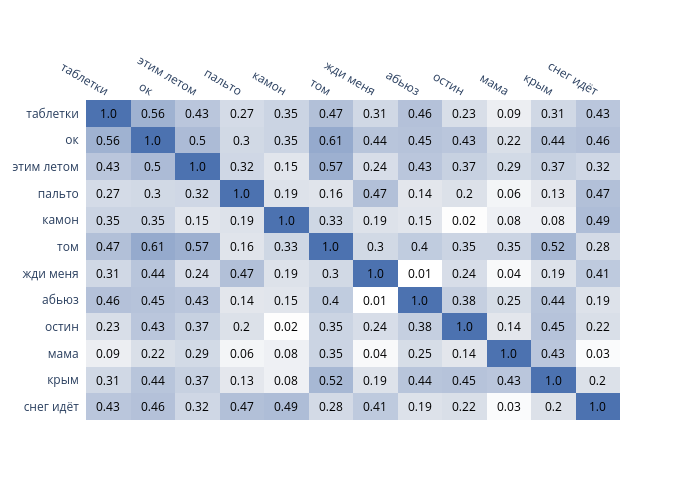
Elisejj's interactive graph and data is a heatmap. The x-axis shows values from 0 to 0. The y-axis shows values from 0 to 0. This visualization has the following annotations: 0.43; 0.46; 0.32; 0.47; 0.49; 0.28; 0.41; 0.19; 0.22; 0.03; 0.2; 1.0; 0.31; 0.44; 0.37; 0.13; 0.08; 0.52; 0.19; 0.44; 0.45; 0.43; 1.0; 0.2; 0.09; 0.22; 0.29; 0.06; 0.08; 0.35; 0.04; 0.25; 0.14; 1.0; 0.43; 0.03; 0.23; 0.43; 0.37; 0.2; 0.02; 0.35; 0.24; 0.38; 1.0; 0.14; 0.45; 0.22; 0.46; 0.45; 0.43; 0.14; 0.15; 0.4; 0.01; 1.0; 0.38; 0.25; 0.44; 0.19; 0.31; 0.44; 0.24; 0.47; 0.19; 0.3; 1.0; 0.01; 0.24; 0.04; 0.19; 0.41; 0.47; 0.61; 0.57; 0.16; 0.33; 1.0; 0.3; 0.4; 0.35; 0.35; 0.52; 0.28; 0.35; 0.35; 0.15; 0.19; 1.0; 0.33; 0.19; 0.15; 0.02; 0.08; 0.08; 0.49; 0.27; 0.3; 0.32; 1.0; 0.19; 0.16; 0.47; 0.14; 0.2; 0.06; 0.13; 0.47; 0.43; 0.5; 1.0; 0.32; 0.15; 0.57; 0.24; 0.43; 0.37; 0.29; 0.37; 0.32; 0.56; 1.0; 0.5; 0.3; 0.35; 0.61; 0.44; 0.45; 0.43; 0.22; 0.44; 0.46; 1.0; 0.56; 0.43; 0.27; 0.35; 0.47; 0.31; 0.46; 0.23; 0.09; 0.31; 0.43