Edit chart
Loading graph
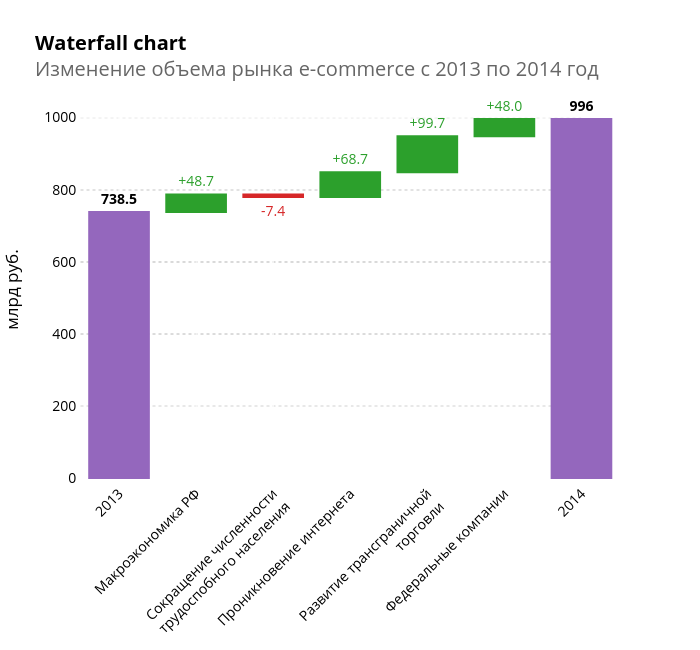
Elisejj's interactive graph and data of "Waterfall chartИзменение объема рынка e-commerce с 2013 по 2014 год" is a waterfall, showing e-commerce; with млрд руб. in the y-axis. The x-axis shows values from 0 to 0. The y-axis shows values from 0 to 0.