Edit chart
Loading graph
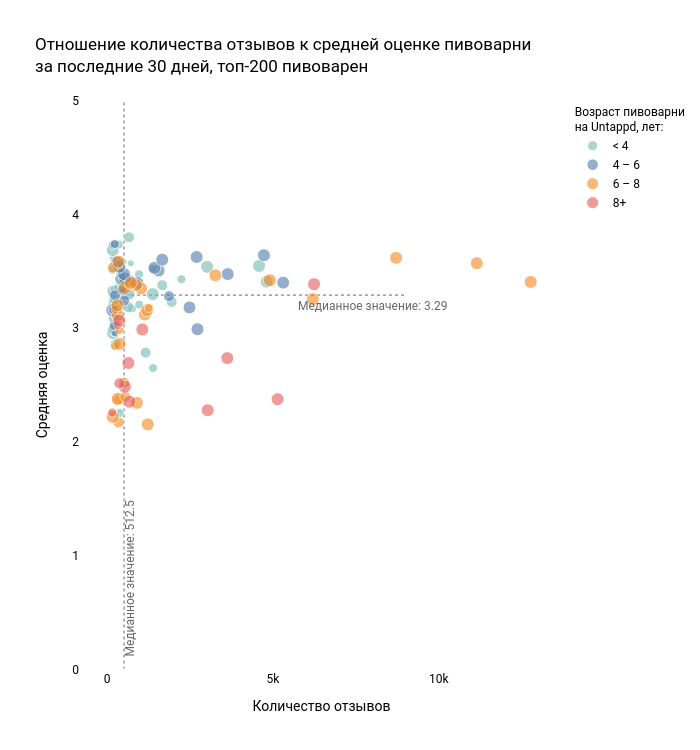
Elisejj's interactive graph and data of "Отношение количества отзывов к средней оценке пивоварниза последние 30 дней, топ-200 пивоварен" is a scatter chart, showing < 4, 4 – 6, 6 – 8, 8+; with Количество отзывов in the x-axis and Средняя оценка in the y-axis.. The x-axis shows values from 0 to 0. The y-axis shows values from 0 to 0. This visualization has the following annotations: Медианное значение: 3.29; Медианное значение: 512.5