Edit chart
Loading graph
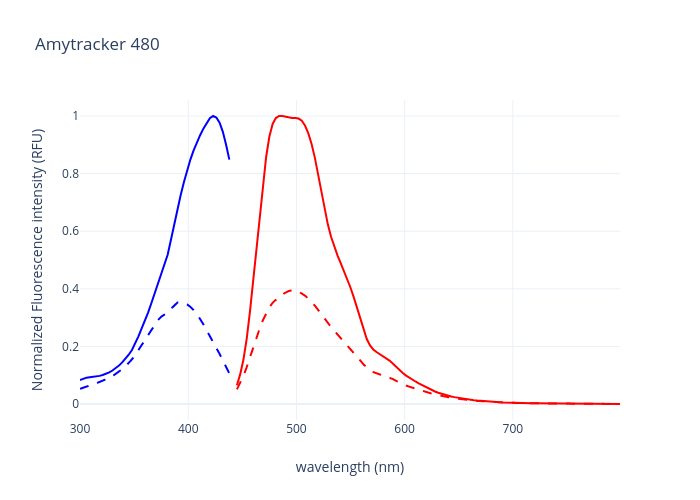
Ebbabiotechab's interactive graph and data of "Amytracker 480" is a line chart, showing Excitation (bound), Excitation (unbound), Emission (bound), Emission (unbound); with wavelength (nm) in the x-axis and Normalized Fluorescence intensity (RFU) in the y-axis.. The x-axis shows values from 300 to 799. The y-axis shows values from -0.05539423394444444 to 1.0555470649444445.