Edit chart
Loading graph
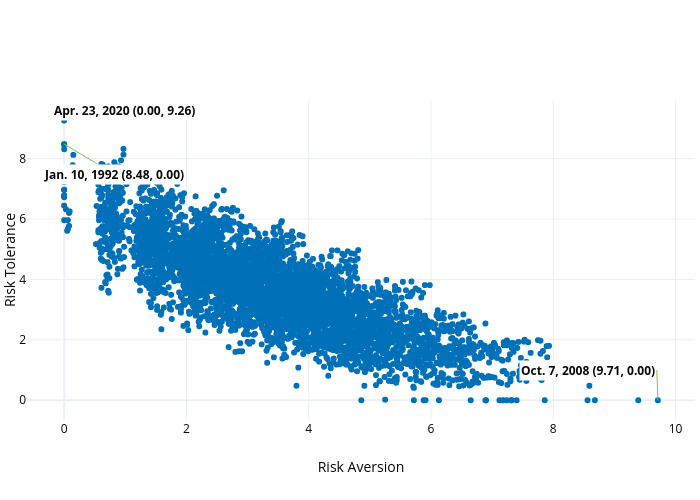
Ecincotta's interactive graph and data of "{'font': {'size': 17, 'family': 'Roboto'}}" is a scatter chart, showing ; with Risk Aversion in the x-axis and Risk Tolerance in the y-axis.. The x-axis shows values from -0.7457757296466976 to 10.391141833077318. The y-axis shows values from -0.7038479809976247 to 10.073824228028503. This visualization has the following annotations: Oct. 7, 2008 (9.71, 0.00); Apr. 23, 2020 (0.00, 9.26); Jan. 10, 1992 (8.48, 0.00)