Edit chart
Loading graph
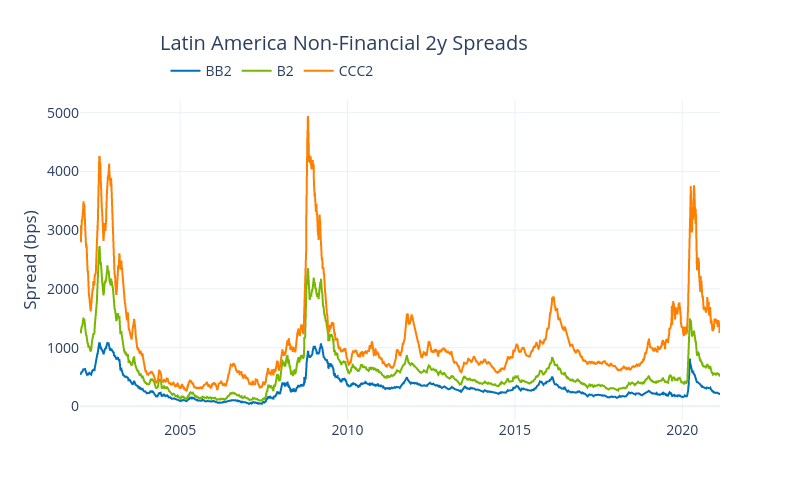
Ecincotta's interactive graph and data of "Latin America Non-Financial 2y Spreads" is a line chart, showing BB2, B2, CCC2; with time in the x-axis and Spread (bps) in the y-axis.. The x-axis shows values from 2002-01-04 to 2021-02-16. The y-axis shows values from -232.06637661833332 to 5216.307030348333.