Edit chart
Loading graph
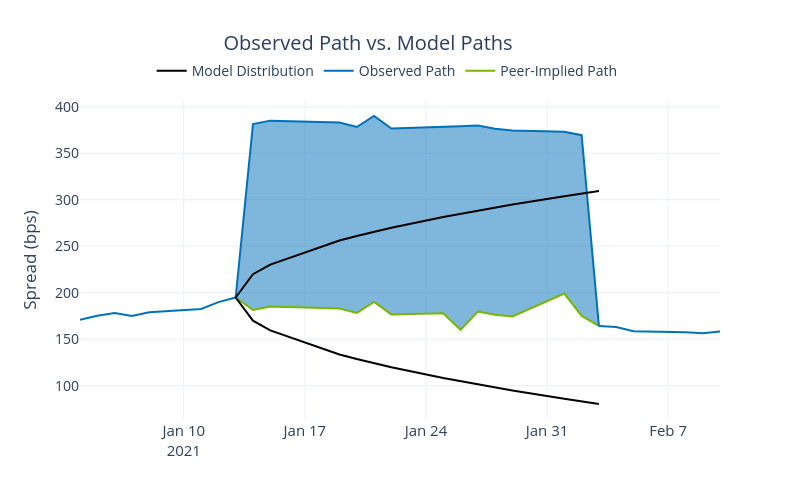
Ecincotta's interactive graph and data of "Observed Path vs. Model Paths" is a line chart, showing Peer-Implied Path, Observed Path, Observed Path, Model Distribution, Model Distribution; with time in the x-axis and Spread (bps) in the y-axis.. The x-axis shows values from 2021-01-04 to 2021-02-10. The y-axis shows values from 63.0451805161111 to 407.2081483938889.