Edit chart
Loading graph
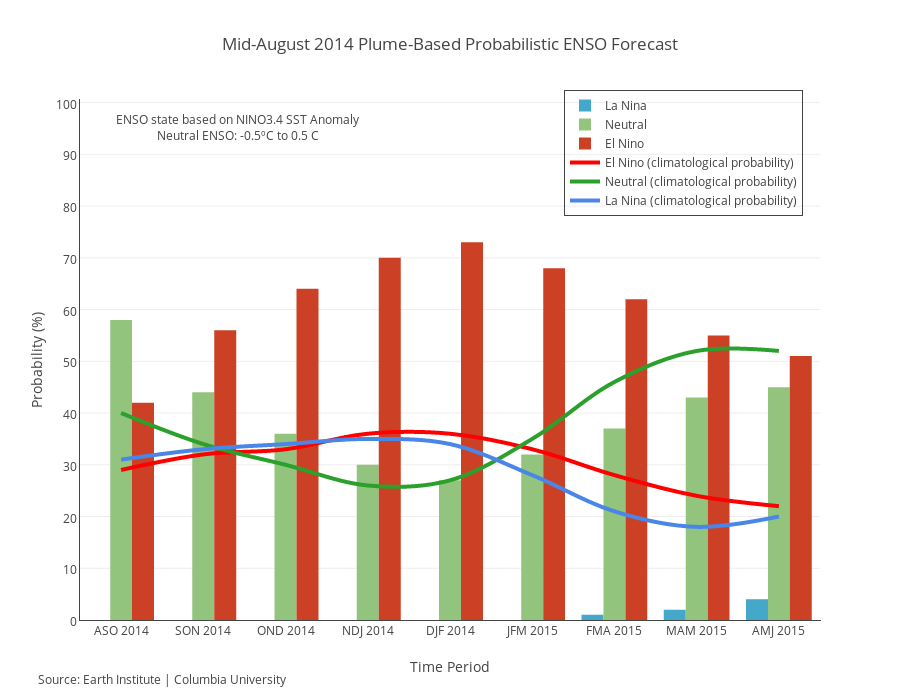
Dreamshot's interactive graph and data of "Mid-August 2014 Plume-Based Probabilistic ENSO Forecast" is a grouped bar chart, showing La Nina, Neutral, El Nino, El Nino (climatological probability), Neutral (climatological probability), La Nina (climatological probability); with Time Period in the x-axis and Probability (%) in the y-axis.. The x-axis shows values from -0.5 to 8.5. The y-axis shows values from 0 to 100.5. This visualization has the following annotations: Source: Earth Institute | Columbia University; ENSO state based on NINO3.4 SST AnomalyNeutral ENSO: -0.5ºC to 0.5 C