Edit chart
Loading graph
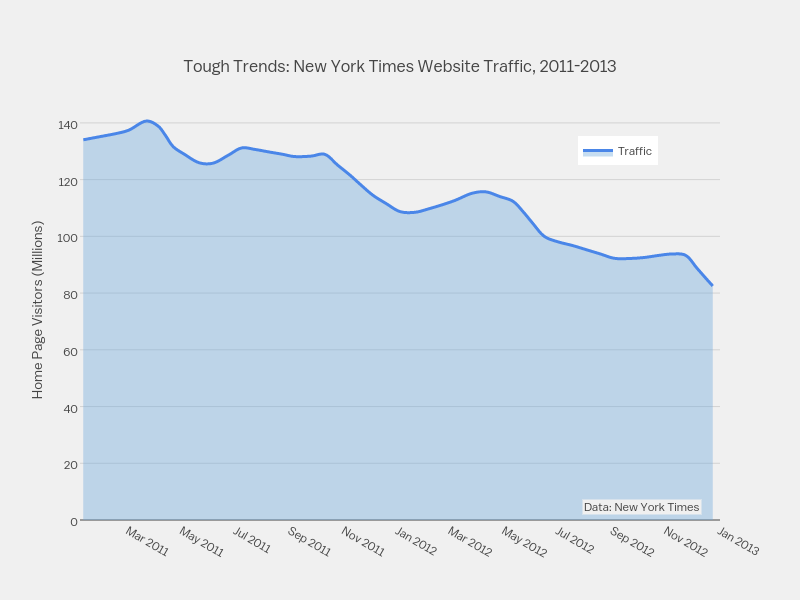
Dreamshot's interactive graph and data of "Tough Trends: New York Times Website Traffic, 2011-2013" is a filled line chart, showing Traffic; with Home Page Visitors (Millions) in the y-axis. The x-axis shows values from 1294203600000 to 1357016400000. The y-axis shows values from 0 to 148.06385313589413. This visualization has the following annotation: Data: New York Times