Edit chart
Loading graph
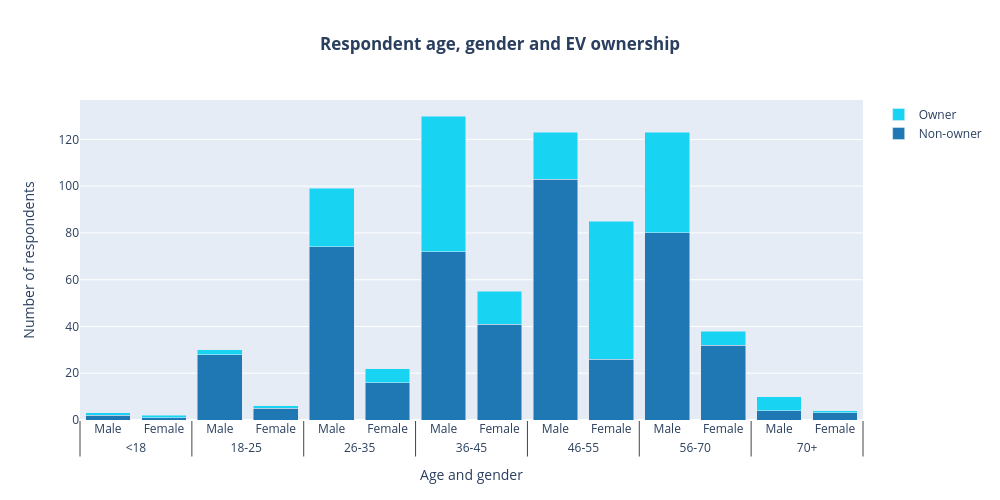
Darylhughes's interactive graph and data of "Respondent age, gender and EV ownership" is a stacked bar chart, showing Non-owner vs Owner; with Age and gender in the x-axis and Number of respondents in the y-axis.. The x-axis shows values from 0 to 0. The y-axis shows values from 0 to 0.