Edit chart
Loading graph
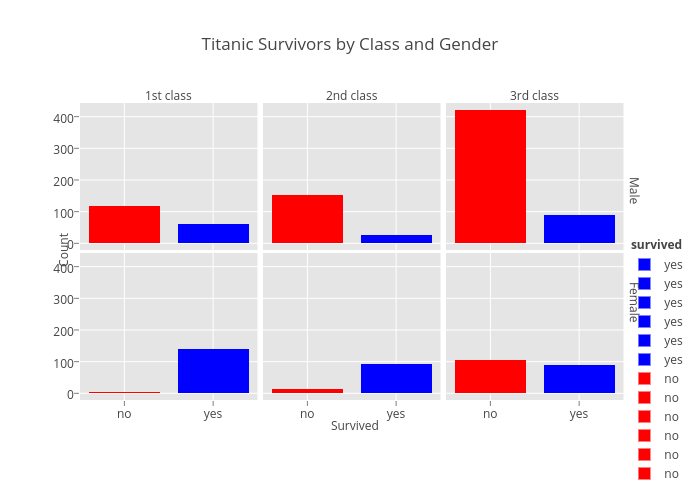
Danielamador's interactive graph and data of "Titanic Survivors by Class and Gender" is a histogram, showing no, no, no, no, no, no, yes, yes, yes, yes, yes, yes. The x-axis shows values from 0 to 0. The y-axis shows values from -21.1 to 443.1. This visualization has the following annotations: Male; Female; 1st class; 2nd class; 3rd class; Survived; Count; survived