Edit chart
Loading graph
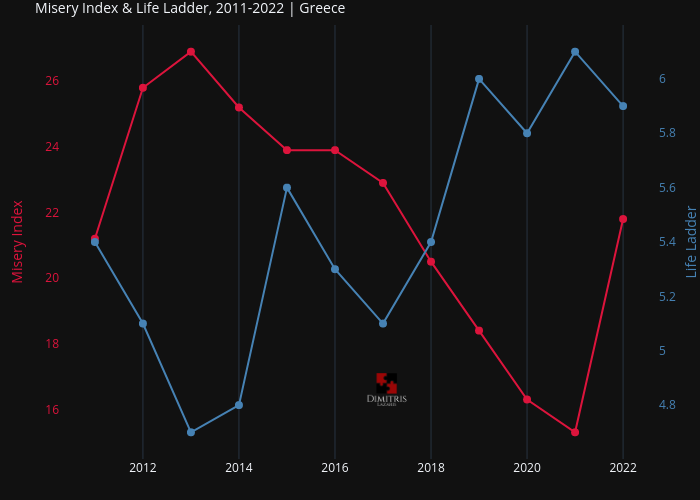
Dlaz's interactive graph and data of "Misery Index & Life Ladder, 2011-2022 | Greece" is a line chart, showing Misery Index vs Life Ladder; with Misery Index in the y-axis. The x-axis shows values from 2010.3299922898998 to 2022.6700077101002. The y-axis shows values from 14.497448478900882 to 27.702551521099117.