Edit chart
Loading graph
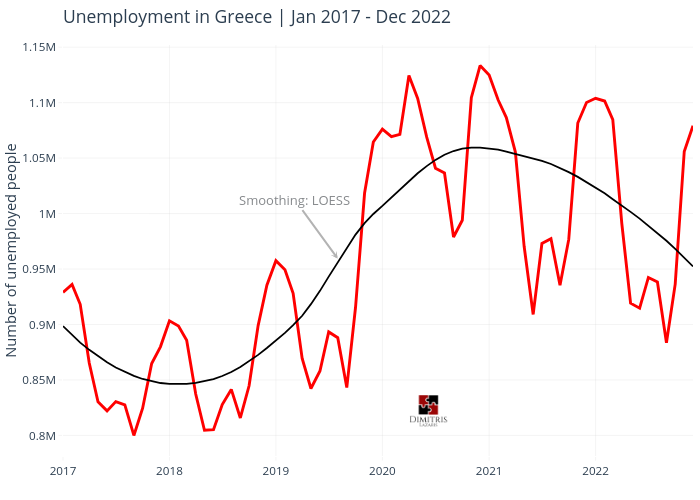
Dlaz's interactive graph and data of "Unemployment in Greece | Jan 2017 - Dec 2022" is a line chart, showing trace 0; with Number of unemployed people in the y-axis. The x-axis shows values from 2017-01-01 to 2022-12-01. The y-axis shows values from 781438 to 1151958. This visualization has the following annotation: Smoothing: LOESS