Edit chart
Loading graph
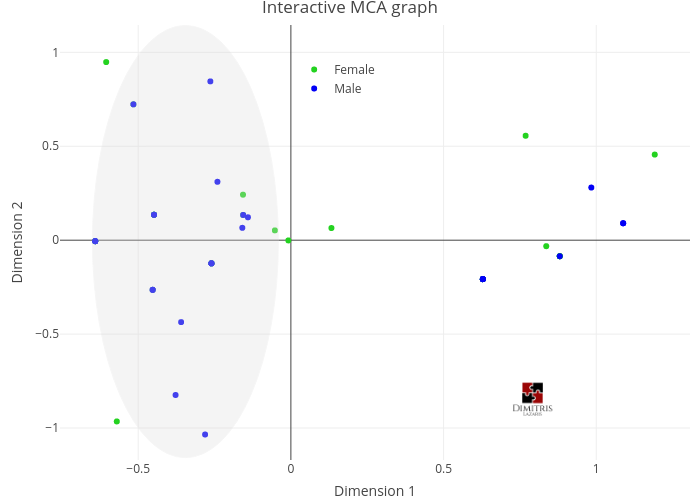
Dlaz's interactive graph and data of "Interactive MCA graph" is a scatter chart, showing Female vs Male; with Dimension 1 in the x-axis and Dimension 2 in the y-axis.. The x-axis shows values from -0.7495319245493247 to 1.3003701626325996. The y-axis shows values from -1.1688950404646874 to 1.14548824827689.