Edit chart
Loading graph
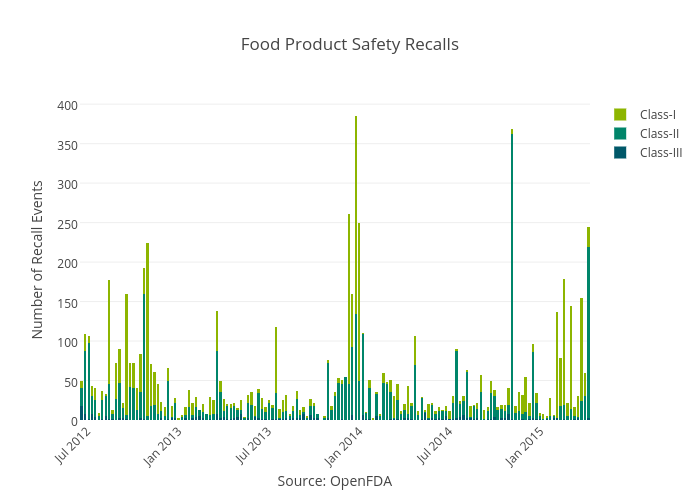
Capt_calculator's interactive graph and data of "Food Product Safety Recalls" is a stacked bar chart, showing Class-III, Class-II, Class-I; with Source: OpenFDA in the x-axis and Number of Recall Events in the y-axis.. The x-axis shows values from 1339905600000 to 1428724800000. The y-axis shows values from 4.831690603168681e-13 to 405.26315789473676.