Edit chart
Loading graph
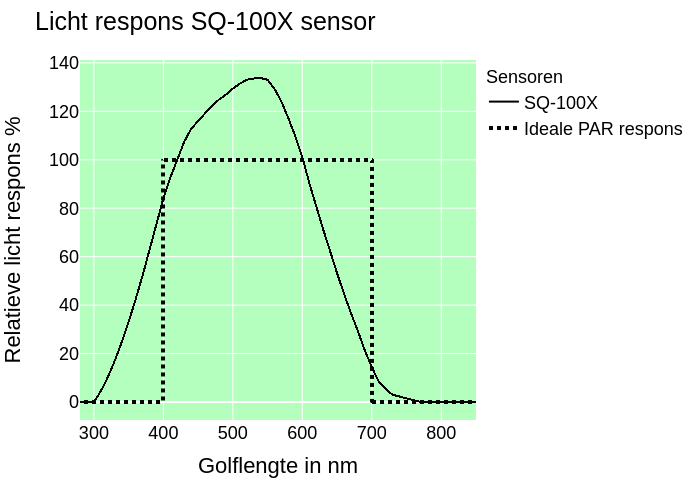
Catecrs's interactive graph and data of "Licht respons SQ-100X sensor" is a scattergl, showing SQ-100X vs Ideale PAR respons; with Golflengte in nm in the x-axis and Relatieve licht respons % in the y-axis.. The x-axis shows values from 0 to 0. The y-axis shows values from 0 to 0.