Edit chart
Loading graph
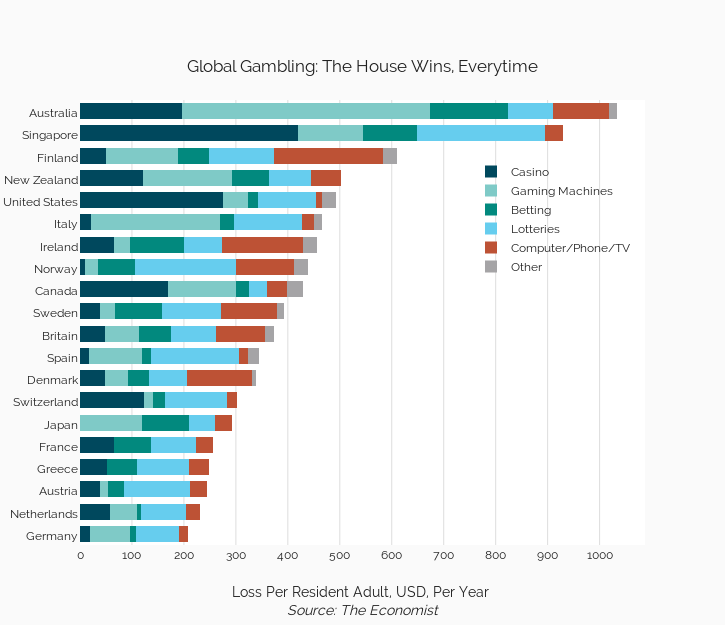
C_sevigny's interactive graph and data of "Global Gambling: The House Wins, Everytime" is a stacked bar chart, showing Casino, Gaming Machines, Betting, Lotteries, Computer/Phone/TV, Other; with Loss Per Resident Adult, USD, Per Year Source: The Economist in the x-axis. The x-axis shows values from 0 to 1087.3684210526317. The y-axis shows values from -0.5 to 19.5.