Edit chart
Loading graph
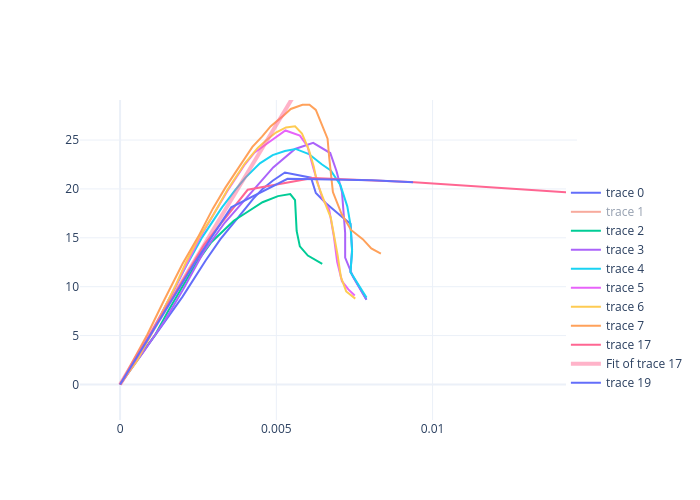
Chifamerabti's interactive graph and data of "trace 4, trace 6, trace 7, trace 19" is a line chart, showing trace 4, trace 6, trace 7, trace 19. The x-axis shows values from -0.0012821798167115901 to 0.014621348787061993. The y-axis shows values from -3.6362008316907604 to 29.096113664177317.