Edit chart
Loading graph
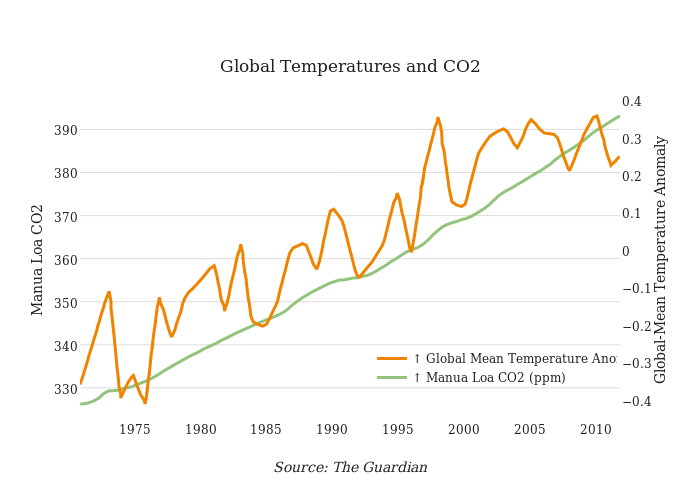
Beths's interactive graph and data of "Global Temperatures and CO2" is a scatter chart, showing ↑ Global Mean Temperature Anomaly (C) vs ↑ Manua Loa CO2 (ppm); with Source: The Guardian in the x-axis and Manua Loa CO2 in the y-axis.. The x-axis shows values from 26629200000 to 1320552000000. The y-axis shows values from 322.54453672422403 to 396.82741335085086.