Edit chart
Loading graph
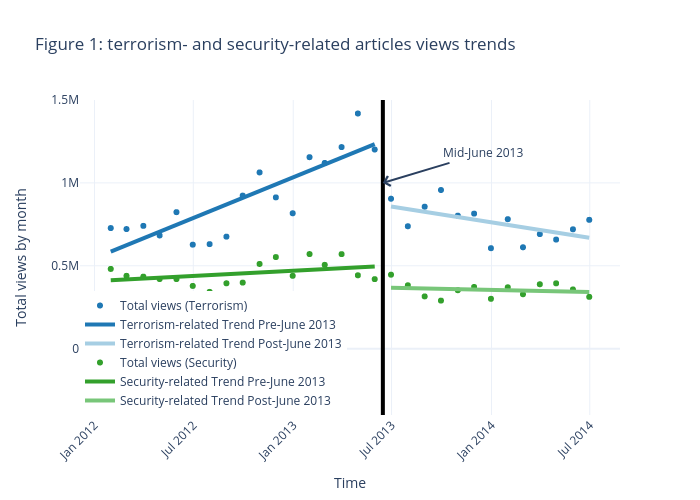
Arturjesslen's interactive graph and data of "Figure 1: terrorism- and security-related articles views trends" is a scatter chart, showing Total views (Terrorism), Terrorism-related Trend Pre-June 2013, Terrorism-related Trend Post-June 2013, Total views (Security), Security-related Trend Pre-June 2013, Security-related Trend Post-June 2013; with Time in the x-axis and Total views by month in the y-axis.. The x-axis shows values from 0 to 0. The y-axis shows values from -400000.0 to 1500000.0. This visualization has the following annotation: Mid-June 2013